Batch Processing Workflow
MKado’s batch processing mode allows you to analyze multiple genes efficiently, with support for parallel execution and flexible output formats.
Note
If you have a VCF file rather than pre-aligned FASTA, see VCF Input Mode instead. mkado vcf supports the same analysis modes, plotting, and output formats as mkado batch.
Basic Batch Processing
To process all alignment files in a directory:
mkado batch alignments/ -i species1 -o species2
This scans for FASTA files (*.fa, *.fasta, *.fna) and runs the MK test on each.
Per-gene vs Aggregated Modes
Tests that estimate a single α across many genes (asymptotic MK, imputed MK, Tarone-Greenland α_TG) accept --aggregate and --per-gene:
--aggregate(default for these tests): pool polymorphism and divergence counts across all input genes, then fit / compute α once. This is the recommended mode for the asymptotic MK test, where per-gene SFS data are too sparse to fit reliably; it also matches the regime in which asymptotic MK has been validated (see Murga-Moreno et al. 2022).--per-gene: run a separate test on each gene and report one α per gene. Useful when you want gene-by-gene point estimates (with the caveat that per-gene asymptotic estimates are noisy).
The standard MK test is naturally per-gene and ignores --aggregate; mkado batch always reports one row per gene for the standard test, plus aggregated counts in the summary.
# Aggregated asymptotic MK (default)
mkado batch alignments/ -i species1 -o species2 -a

# Per-gene asymptotic MK (one α per gene)
mkado batch alignments/ -i species1 -o species2 -a --per-gene
File Organization
Combined File Mode (Recommended)
Each file contains sequences from all species, filtered by name pattern:
alignments/
├── gene1.fa    # Contains species1 and species2 sequences
├── gene2.fa
└── gene3.fa
Usage:
mkado batch alignments/ -i "ingroup_pattern" -o "outgroup_pattern"
The -i and -o options filter sequences by substring matching in sequence names.
Separate Files Mode
Ingroup and outgroup sequences in separate files:
genes/
├── gene1_in.fa   # Ingroup sequences
├── gene1_out.fa  # Outgroup sequences
├── gene2_in.fa
└── gene2_out.fa
Usage:
mkado batch genes/ --ingroup-pattern "*_in.fa" --outgroup-pattern "*_out.fa"
Asymptotic Batch Analysis
The asymptotic MK test bins polymorphisms by derived allele frequency and extrapolates alpha to remove the bias from slightly deleterious mutations. Derived alleles are identified by comparison with the outgroup: alleles shared between ingroup and outgroup are ancestral, and the derived frequency is calculated within the ingroup. See Getting Started Tutorial for details on polarization.
For asymptotic MK tests, you can either:
Aggregate results (default): Pool polymorphism data across all genes, then fit a single curve
Per-gene analysis: Run separate asymptotic tests for each gene
Aggregated Analysis
# Pool data across genes (more statistical power)
mkado batch alignments/ -i species1 -o species2 -a
This outputs a single asymptotic alpha estimate for the entire gene set.
By default, the 95% CI is computed by sampling parameters from the curve-fit
covariance matrix (parametric Monte Carlo). Pass --ci-method bootstrap
for case-resampling of the pooled polymorphism list — slower per replicate
but more principled for small per-bin counts:
# Bootstrap CI (refit per replicate)
mkado batch alignments/ -i species1 -o species2 -a --ci-method bootstrap
See Asymptotic MK Test for when to choose each.
Asymptotic Alpha Plot
When running aggregated asymptotic analysis, you can generate a plot showing how α(x) varies with derived allele frequency, similar to Messer & Petrov (2013):
# Generate alpha(x) vs frequency plot with 20 frequency bins
mkado batch alignments/ -i species1 -o species2 -a -b 20 --plot-asymptotic alpha_fit.png
The plot shows:
Scatter points: Observed α values at each frequency bin
Fitted curve: Exponential (or linear) fit to the data
Horizontal line: Asymptotic α estimate with 95% confidence interval band
This visualization helps assess the fit quality and understand how slightly deleterious mutations affect α estimates at different frequencies.
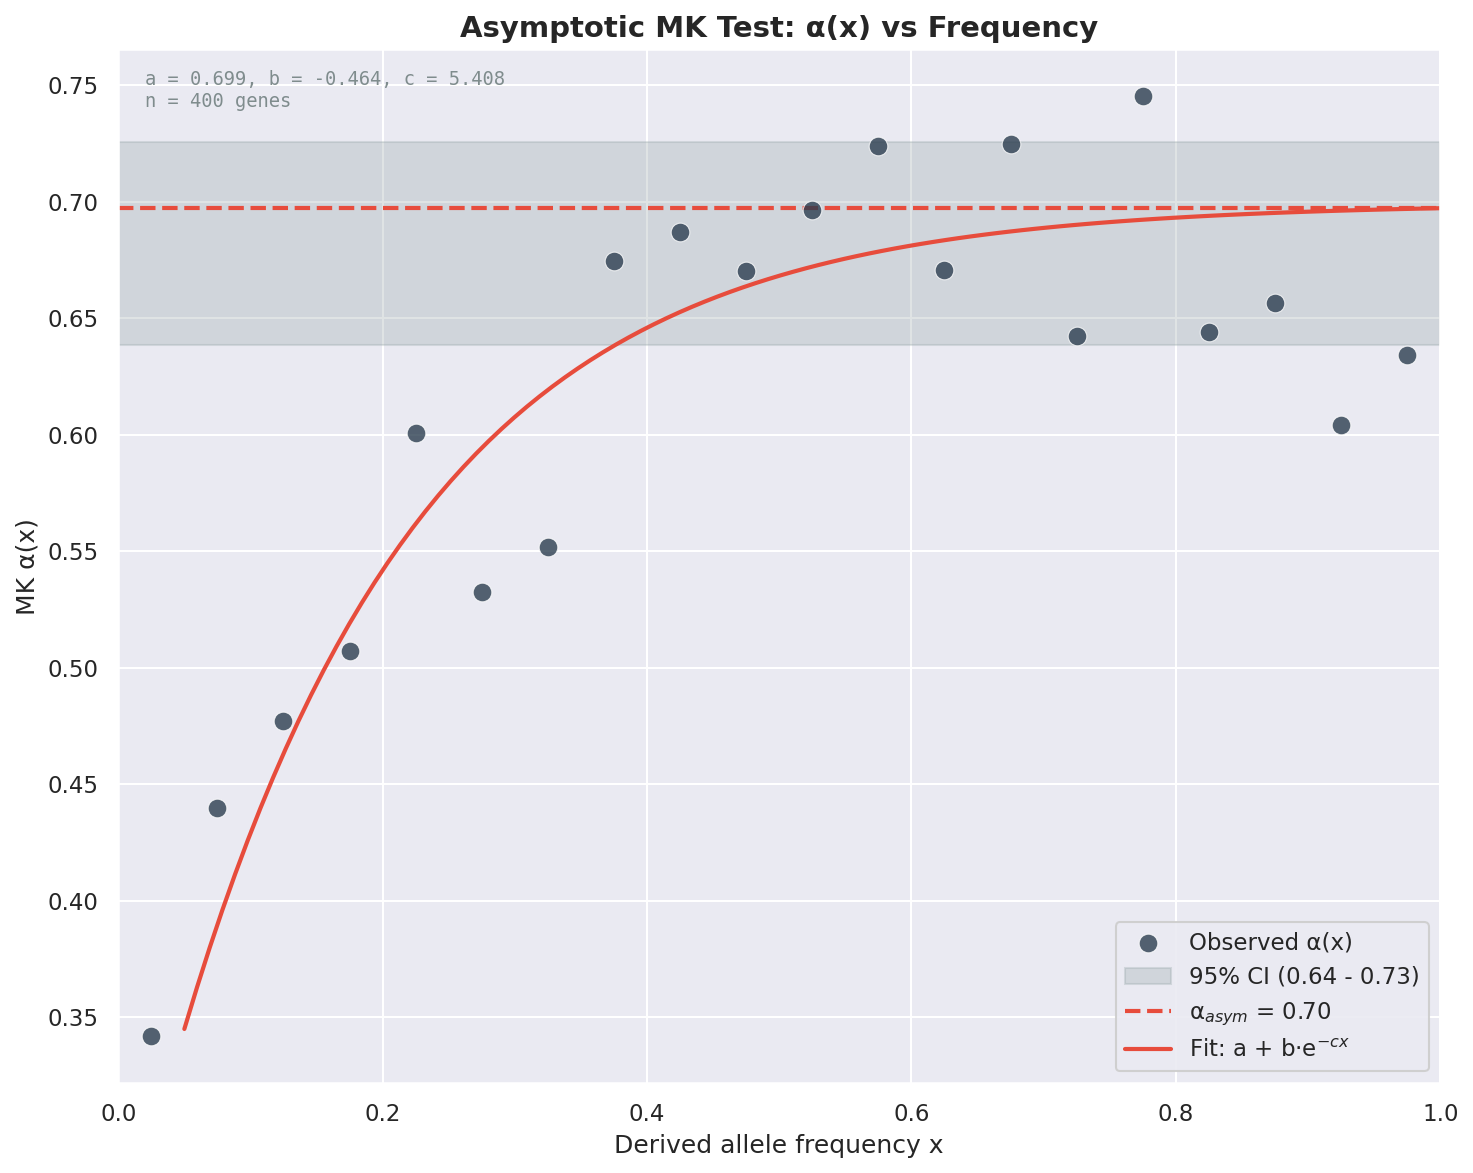
Example asymptotic α(x) plot from the Anopheles batch example data.
Per-Gene Analysis
# Separate analysis per gene
mkado batch alignments/ -i species1 -o species2 -a --per-gene
This outputs asymptotic results for each gene individually.
See Asymptotic MK Test for full details on the asymptotic methodology, model selection, and interpretation.
Tarone-Greenland Alpha (α_TG)
For a weighted multi-gene estimate that corrects for sample size heterogeneity without frequency spectrum modeling:
mkado batch alignments/ -i species1 -o species2 --alpha-tg
See Tarone-Greenland Alpha (α_TG) for details on when to use α_TG vs. asymptotic α.
Parallel Processing
Use the -w option to control parallelization:
# Auto-detect CPU count
mkado batch alignments/ -i species1 -o species2 -w 0

# Use 8 workers
mkado batch alignments/ -i species1 -o species2 -w 8

# Sequential processing
mkado batch alignments/ -i species1 -o species2 -w 1
Output Formats
Pretty Print (Default)
Human-readable table format:
mkado batch alignments/ -i species1 -o species2
Tab-Separated Values
For downstream analysis:
mkado batch alignments/ -i species1 -o species2 -f tsv > results.tsv
Columns: gene, Dn, Ds, Pn, Ps, p_value, p_value_adjusted, NI, alpha, DoS
JSON
For programmatic processing:
mkado batch alignments/ -i species1 -o species2 -f json > results.json
Multiple Testing Correction
When running batch analyses, MKado automatically applies Benjamini-Hochberg (BH) correction for multiple testing. This controls the false discovery rate (FDR) when testing many genes simultaneously.
The adjusted p-values are reported alongside the raw Fisher’s exact test p-values:
p_value: Raw p-value from Fisher’s exact test for each gene
p_value_adjusted: BH-adjusted p-value accounting for multiple comparisons
Example output (TSV format):
gene        Dn  Ds  Pn  Ps  p_value     p_value_adjusted  NI        alpha
AGAP000150  12  28  17  15  0.056485    0.143119          2.644444  -1.644444
AGAP000432  12  59  14  13  0.000853    0.005128          5.294872  -4.294872
AGAP001364  2   19  3   18  1           1                 1.583333  -0.583333
Use p_value_adjusted when interpreting significance across multiple genes to control for false discoveries.
Volcano Plots
MKado can generate volcano plots to visualize batch results. Volcano plots show the relationship between effect size (Neutrality Index) and statistical significance across all genes.
# Generate a volcano plot
mkado batch alignments/ -i species1 -o species2 --volcano results.png

# Save as PDF for publication
mkado batch alignments/ -i species1 -o species2 --volcano figure.pdf

# Save as SVG for editing
mkado batch alignments/ -i species1 -o species2 --volcano figure.svg
Plot Features
The volcano plot displays:
X-axis: -log10(NI) — Neutrality Index transformed to show direction of selection
Y-axis: -log10(p-value) — Statistical significance
Bonferroni threshold line: Horizontal dashed line indicating the significance threshold after multiple testing correction
NI = 1 reference line: Vertical dotted line at neutral expectation
Interpreting the Plot
Points to the left (negative X values): NI > 1, excess polymorphism, suggesting segregating weakly deleterious variants
Points to the right (positive X values): NI < 1, excess divergence, suggesting positive selection
Points above the threshold line: Statistically significant after Bonferroni correction
Red points: Genes significant after multiple testing correction
Blue points: Non-significant genes
Example:
# Generate volcano plot with example data
mkado batch examples/anopheles_batch/ -i gamb -o afun --volcano volcano.png
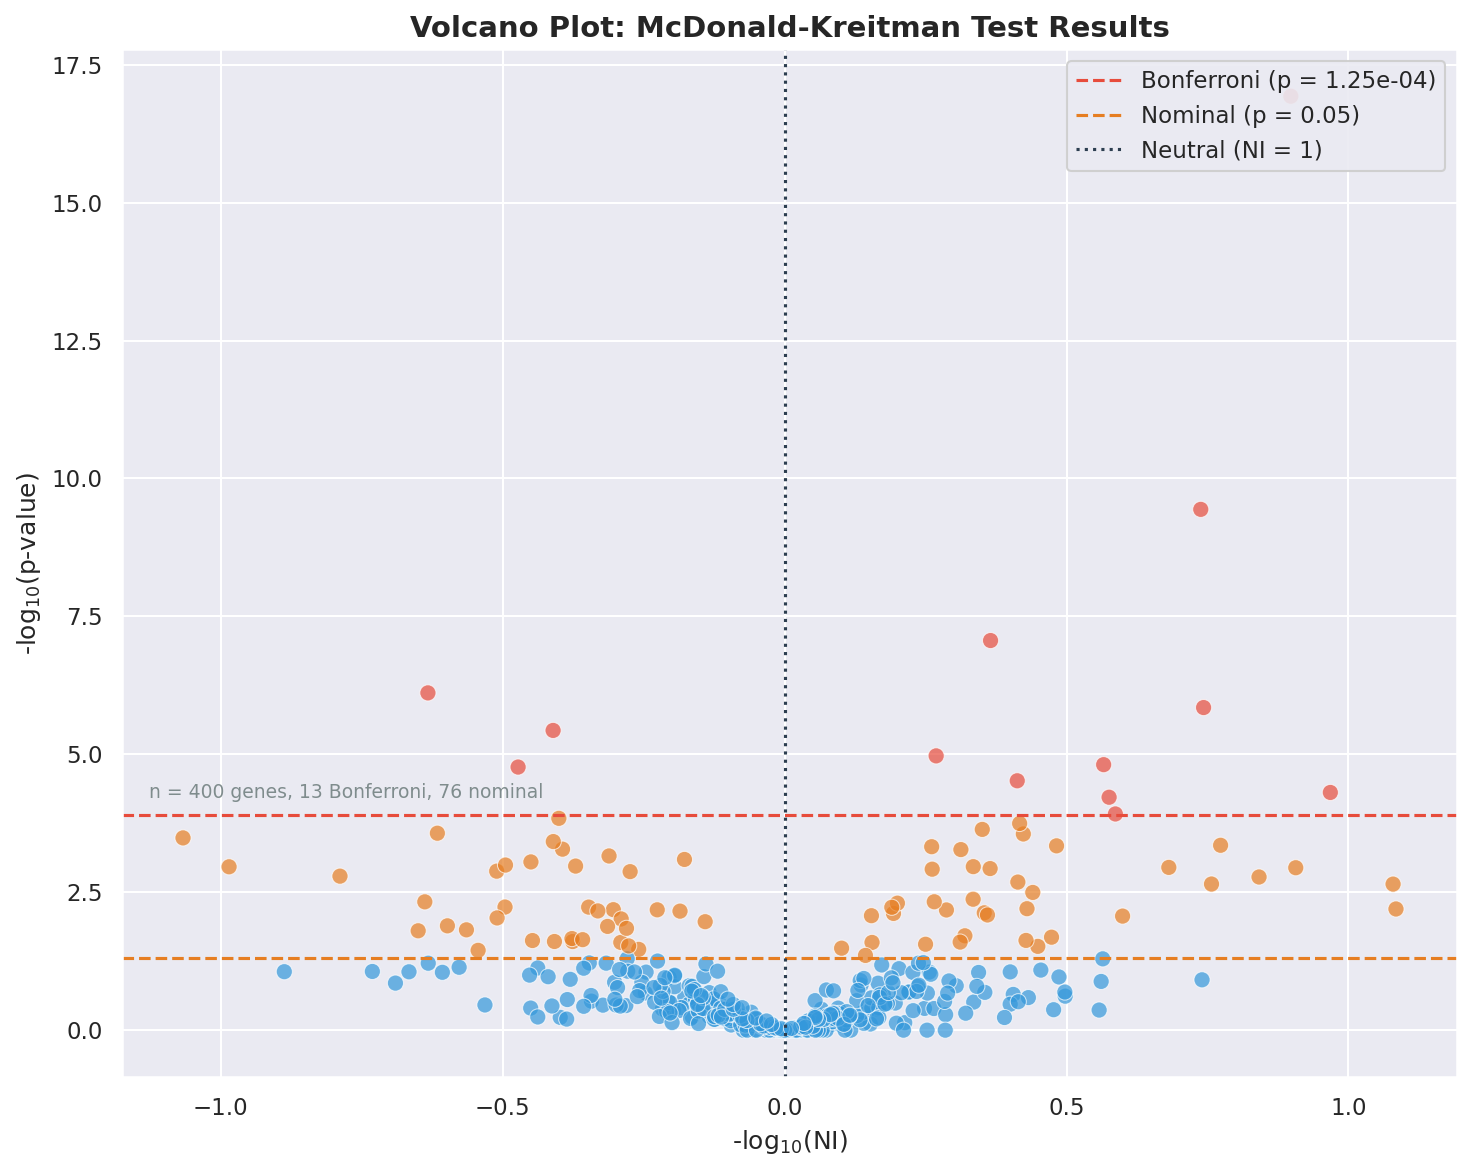
Example volcano plot from the Anopheles batch example data.
File Filtering
Customize which files are processed:
# Specific pattern
mkado batch alignments/ -i sp1 -o sp2 --pattern "*.fasta"

# Multiple extensions (default behavior)
# Automatically detects *.fa, *.fasta, *.fna
Advanced Options
Frequency Bins
Customize bin count for asymptotic analysis:
mkado batch alignments/ -i sp1 -o sp2 -a -b 20
Reading Frame
Specify reading frame for non-standard alignments:
mkado batch alignments/ -i sp1 -o sp2 -r 2
Example Workflow
Here’s a complete workflow using the example data:
# 1. Check file info
mkado info examples/anopheles_batch/AGAP000078.fa

# 2. Run standard batch analysis
mkado batch examples/anopheles_batch/ -i gamb -o afun

# 3. Run asymptotic analysis with 20 frequency bins
mkado batch examples/anopheles_batch/ -i gamb -o afun -a -b 20

# 4. Export results for downstream analysis
mkado batch examples/anopheles_batch/ -i gamb -o afun -f tsv > results.tsv

# 5. Generate a volcano plot for visualization
mkado batch examples/anopheles_batch/ -i gamb -o afun --volcano results.png

# 6. Generate asymptotic alpha plot
mkado batch examples/anopheles_batch/ -i gamb -o afun -a -b 20 --plot-asymptotic asymptotic.png